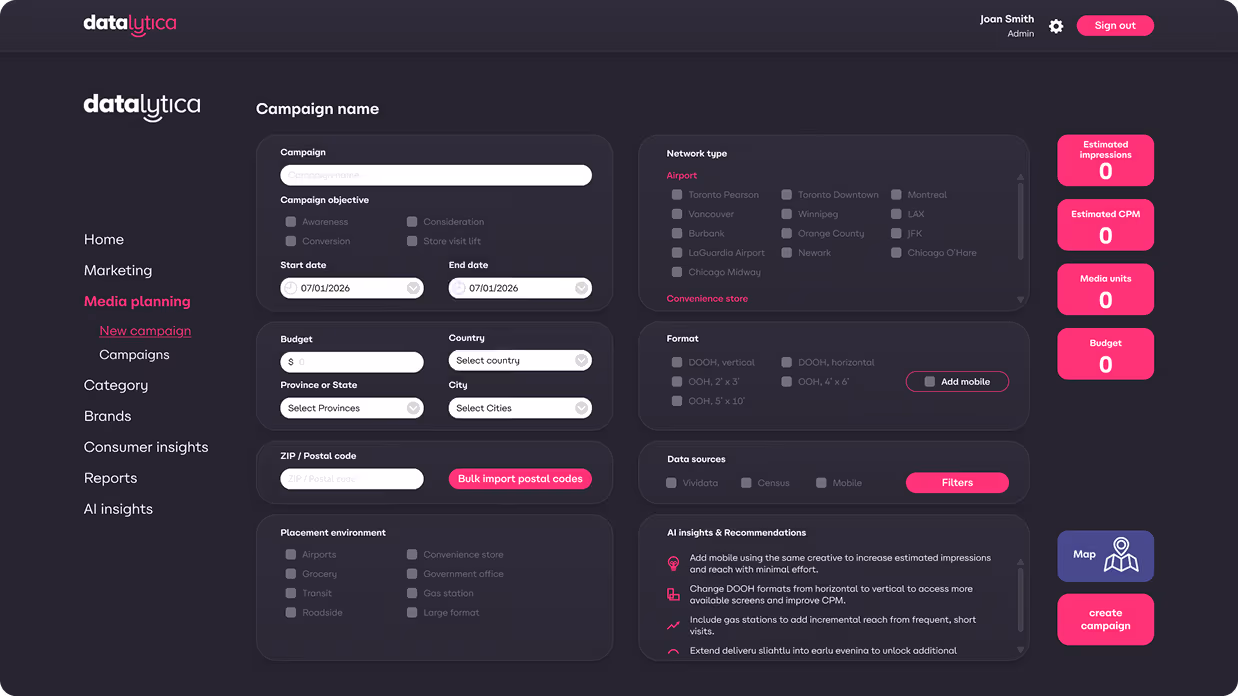
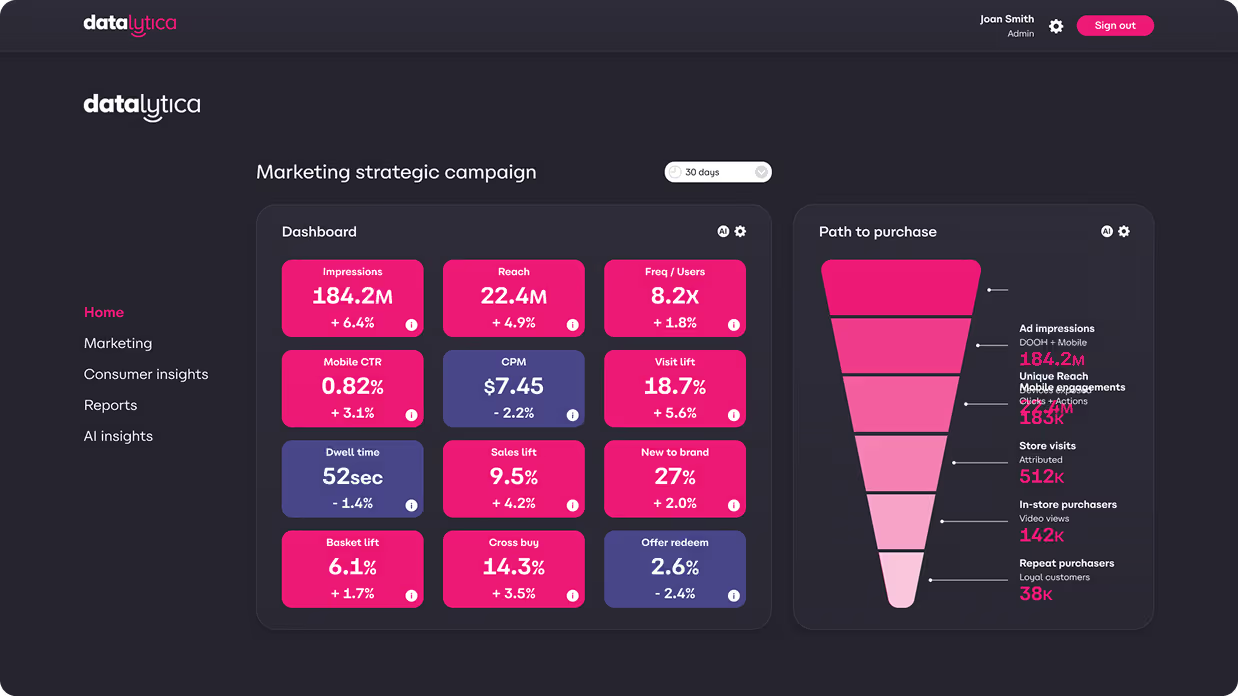
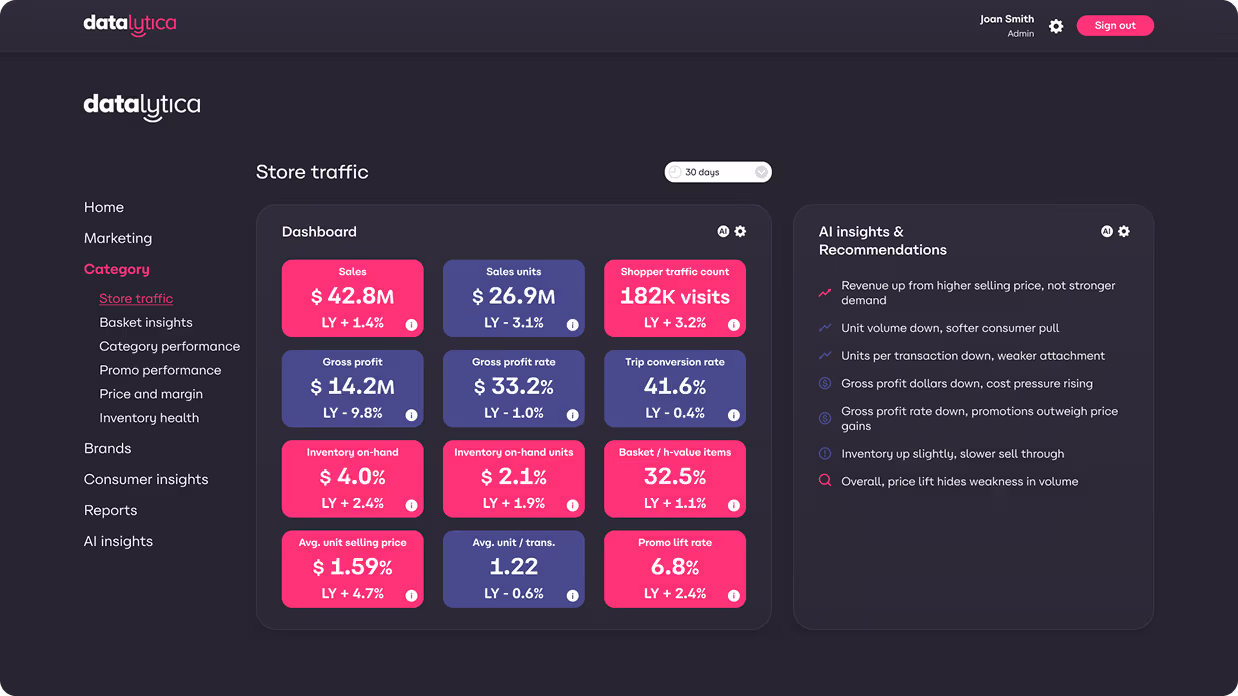
Data simplified

Insights amplified.

In today's hyperconnected world, data has become the lifeblood of businesses. Organizations are constantly seeking ways to harness the power of data to gain insights into their customers, understand market trends, and make informed decisions.

dashboard
HOW IT WORKS

Revolutionizing the way businesses leverage their own data

Datalytica is a cutting-edge data management platform that delivers impactful consumer and business insights.

Data fusion intelligence

Business intelligence platform that combines your internal company data with a curated amount of Datalytica data to understand your business.

Automated data ingestion

We’ll ingest all the various data sets (Sales reports, inventory reports, CRM Files) you have across your business units.

Data refinement and insights

Clean, classify and segment your data into business insights.

Strategic data enhancement

Following the analysis of your data we will incorporate a strategic selection of data to enhance your data to solve business challenges.

feature image
HOW IT WORKS

Unified Data: Transforming Diverse Types into Deeper Insights

Unlocking the pulse of consumer insights

Real-time precision

A treasure trove of information that is continuously generated by the vast network of connected devices, sensors, and applications in the physical world.

Unparalleled audience insights

Near location data provides a granular view of consumer behavior, preferences, and movement patterns.

Data-driven market advantage

Leverage this treasure trove of information to stay ahead of competitors and gain unparalleled insights into their target audiences and markets.

WHY

Complete data mastery

Exceptional UI & flexible data integration

Business-user friendly interface

Datalytica enables businesses to easily visualize and interact with data through intuitive dashboards and reports. According to G2, Flowbite is the easiest-to-use tool, with the fastest time to ROI.

Flexible data integration

The platform also offers flexible integration options, allowing businesses to seamlessly integrate their data.

Client first-party data

Consolidate your internal company data to optimize business insights and address challenges by integrating sales, inventory, marketing, and CRM data.

feature image
WHY

Robust and sophisticated data processing capabilities

Datalytica employs state-of-the-art algorithms and machine learning models to process and analyze vast amounts of Near Location based data in real-time, allowing businesses to access actionable insights without delay.

Data Privacy and Compliance Assurance

Our platform adheres to stringent data security standards, protecting sensitive client information, and providing granular data access controls.

AWS

Datalytica leverages the unparalleled capabilities of Amazon Web Services (AWS) to supercharge your data processing needs. With AWS, we harness the power of cloud computing to deliver robust, scalable, secure and sophisticated solutions for your data processing requirements.

add widget
WHY

A centralized data command center

Our custom-built Business Intelligence tool that serves as a centralized command center for analytics, data visualization, and business management. Automated data ingestion, real-time interactive dashboards, and a unified user platform empower your team and clients to make data-driven decisions with ease.

Control your brand

Gain complete control over your campaigns and display insights to clients with your branding under a white-labeled version of the software.

Allow clients to explore

Provide clients access to their own portal so they can track and manage dashboards.

Robust interations

Access insights in real time by connecting to any API through an infinitely scalable infrastructure.

No restrictions

Upload any Excel file and visualize the data with over a dozen chart styles.

Build reusable templates

Easily access custom templates to display dashboards full of valuable insights from raw data files or API.

feature image
OUR TECHNOLOGY

Connect all your data

Effortlessly connect, store, and blend data from hundreds of data sources and SQL databases, whether you're dealing with millions or billions of rows of data. Native integrations seamlessly connect to popular platforms, databases, and CRMs, allowing for continuous data imports and updates. Ensure your metrics are always reliable and up-to-date when making critical business decisions.

Build a single source of truth

With and intuitive point-and-click tools, you no longer need complex SQL queries to clean and prepare your data.

Modern BI & Analytics

Empower every user to explore data and create stunning data visualizations.

One platform for all your data needs

A comprehensive decision-making platform that caters to all your business intelligence, data analytics, and dashboard needs.

Automate your reporting

Streamline your data pipelines and maintain up-to-date data dashboards with automated data refresh schedules.

Explore your data

Enable users at all levels to find answers to their own questions and uncover valuable insights independently.

Share

Facilitate better decision-making by providing access to your dashboards for everyone in your organization.

office feature image
OUR TECHNOLOGY

Chart types

Explore your data using various chart types, including:

  • Scorecard
  • Horizontal Bar chart
  • Vertical Bar chart
  • Stacked bar chart
  • Line graph
  • Area graph
  • Pie chart
  • Donut chart
  • Sunburst chart
  • Table output
  • Tree map
  • Scatter plot
  • Geo spatial/Map based chart
  • Bubble chart
  • Radial tree
office feature image

Wrangle your data

Simplify the process of preparing, cleansing, and transforming data from multiple sources to fuel impactful metrics and dashboards.

Permissions

Assign and manage access permissions to raw stored tables for authorized users within your organization.

Sample templates

Quickly set up data models that have been cleaned and transformed from a single source, allowing you to get started with basic metrics promptly.

Reports

Manipulate data by applying filters, slicing and grouping data, comparing dates, sorting and limiting data display, and summarizing data into key values.

Rollups

Rollup and aggregate reports to get a better understanding of your data.

Trusted sources
eugdpriabdaacadChoices

Contact Us

By submitting this form, you confirm that you have read and agree to Chameleon Digital Media Inc.'s Terms of Service and Privacy Statement

Data simplified.

Insights amplified.